3.3 Lab Activity
Use the anscombe_long.csv data for this lab activity.
3.3.1 Setup
- If you haven’t already, install
ggplot2. - Load
ggplot2. - Import anscombe_long.csv into R as a
data.framenamedanscombe_long. - Convert
anscombe_long$datasetto a factor with levels: 1 = “I”, 2 = “II”, 3 = “III”, and 4 = “IV”.
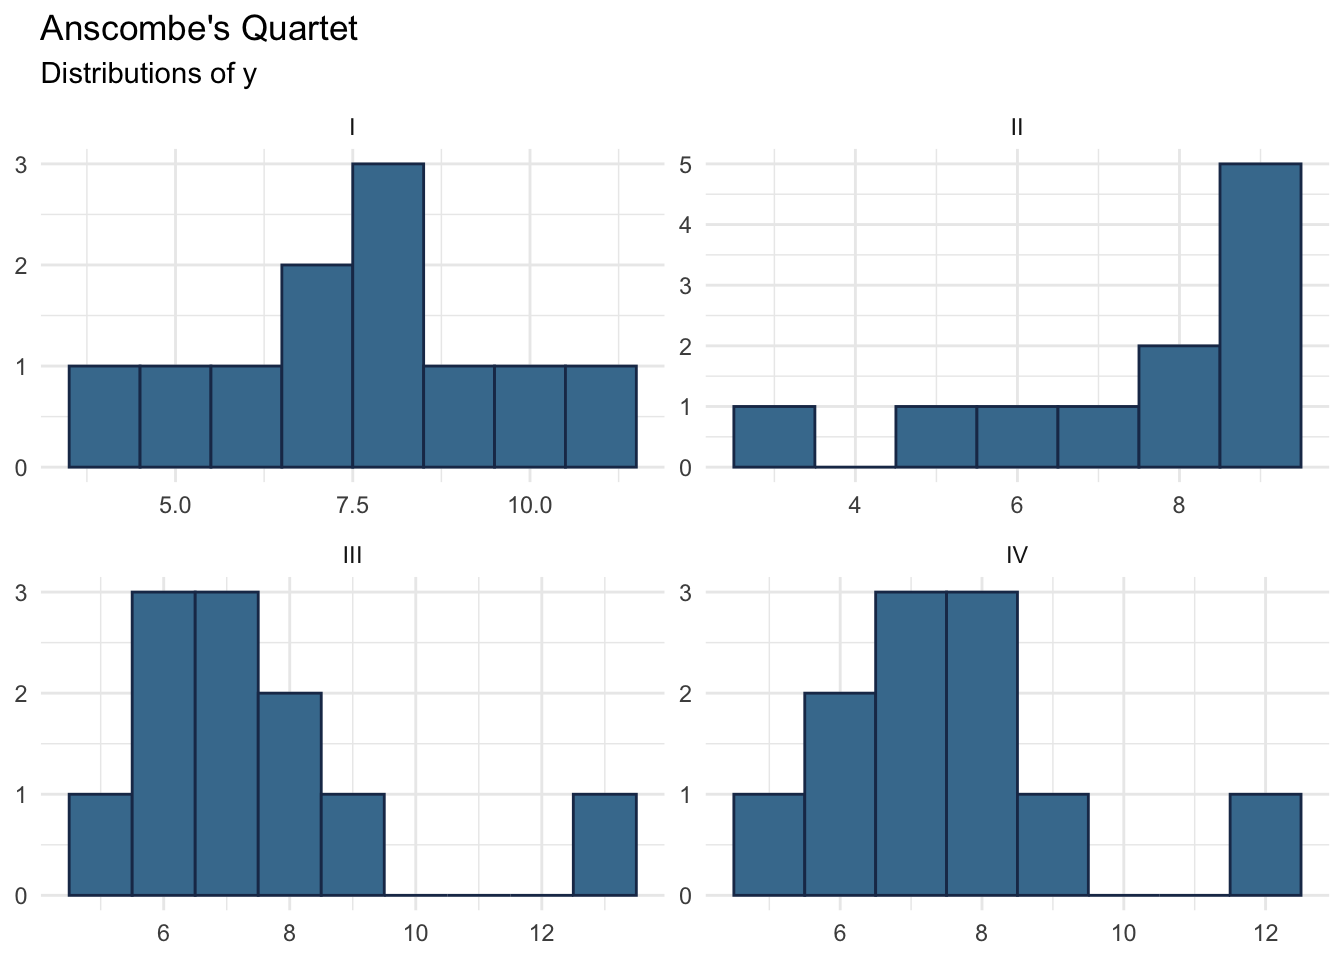
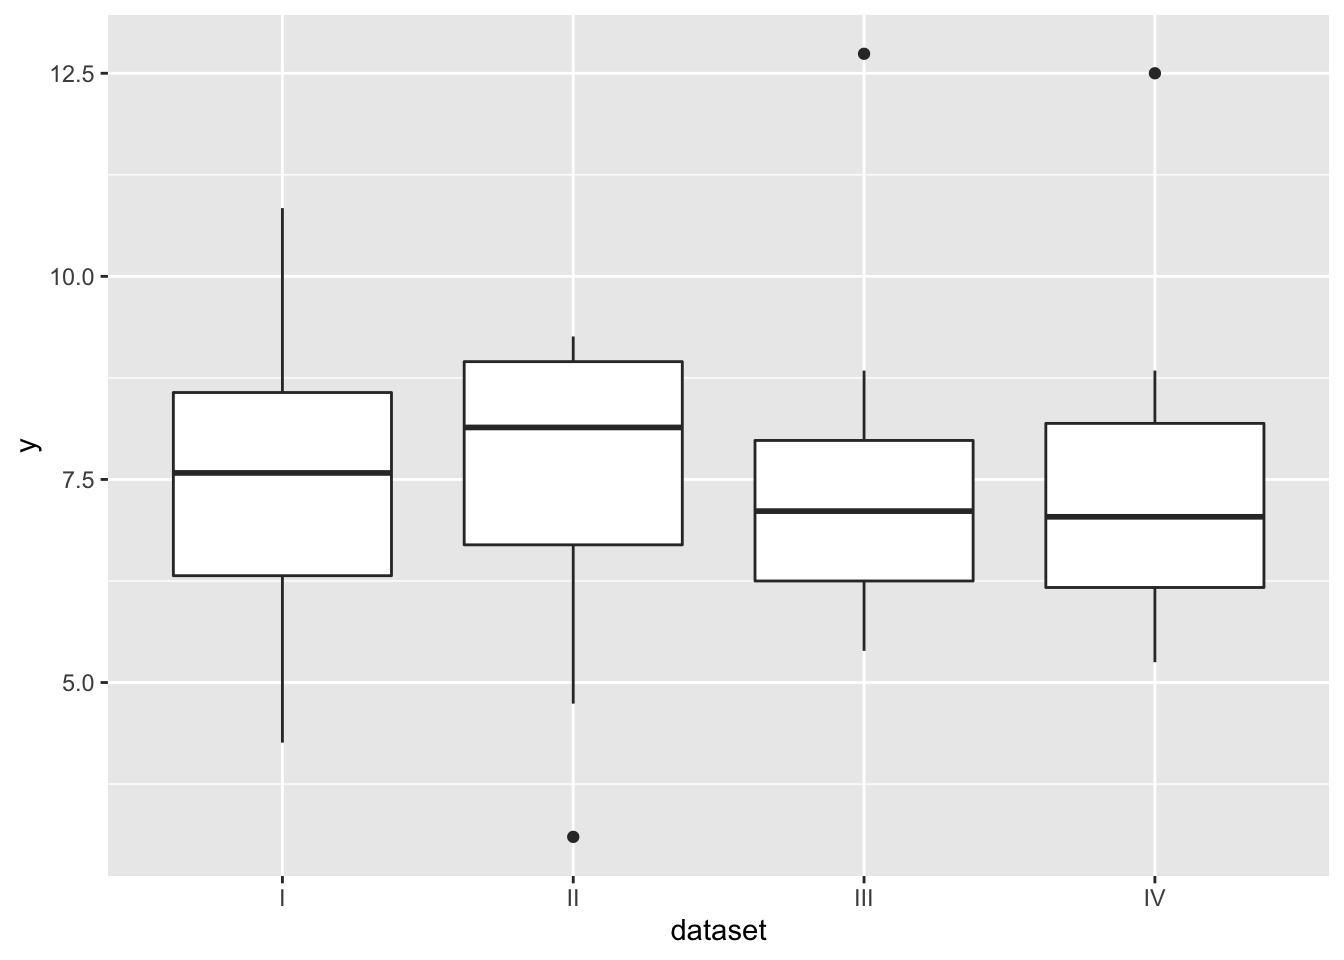
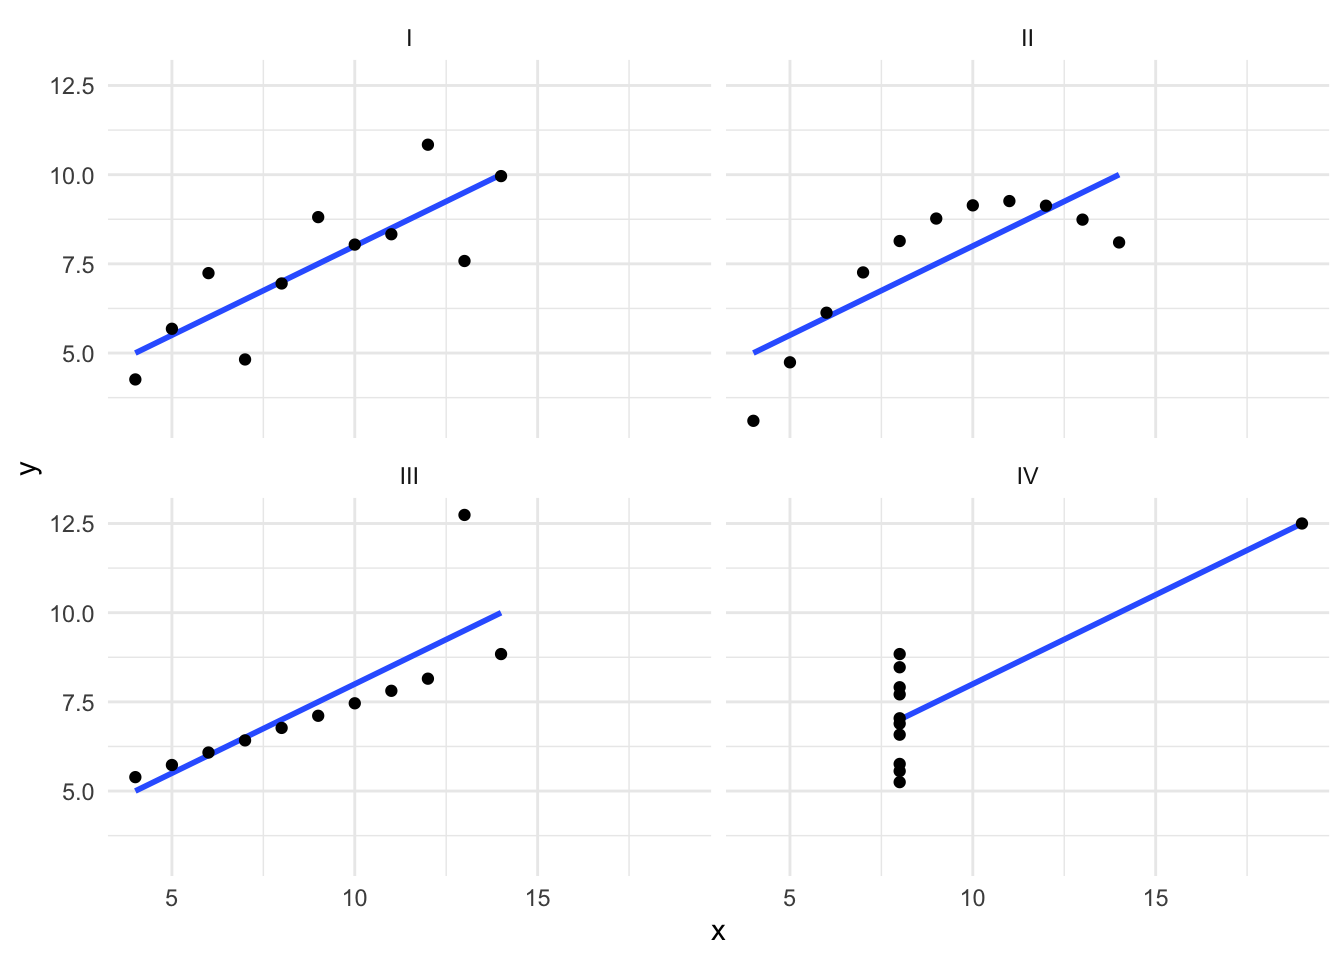
3.3.2 Plots
Write a script to produce each of the following plots. All of them use the anscombe_long.csv data.
3.3.6 Plot 4: Jitter Plot
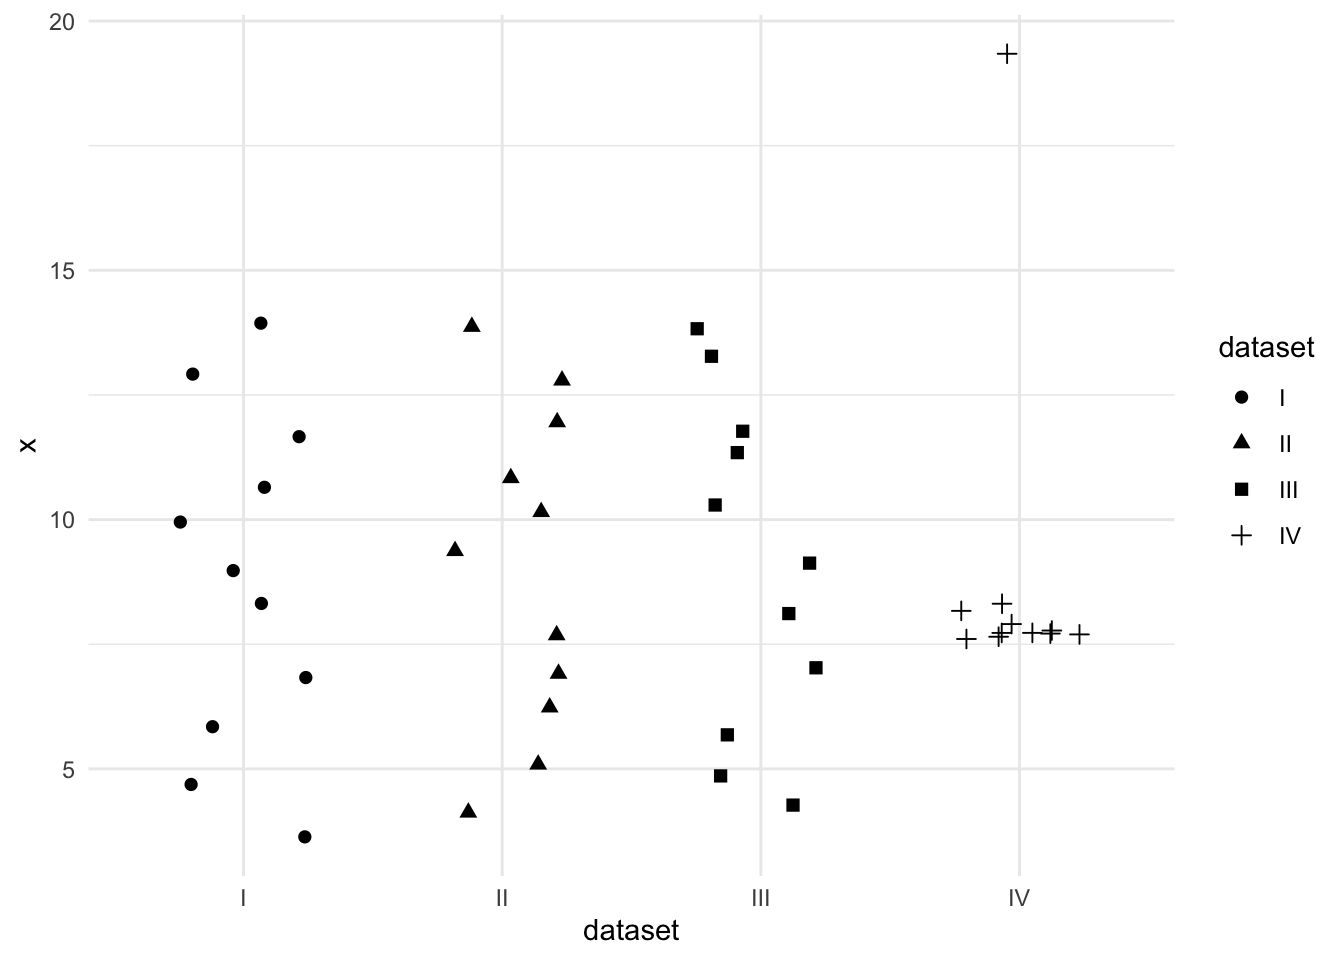
Tips for Recreating Plot 4
Identify the aesthetic mappings before you start.
- Which variable is mapped to x?
- Which is mapped to y?
- Are there any other aesthetic mappings?
Use geom_jitter() to plot the points. geom_jitter() is a variant of geom_point() that adds a small amount of random variation to the placement of the points. It’s useful when points would otherwise be overlapping. Note that the jitter is random, so your plot will not match this one exactly. The jitter can also affect the range of the scale axes.
Set the width of geom_jitter() to be equal to 0.25.
This plot uses theme_minimal(). You are free to use whatever theme you prefer.